Open water data in 3D
Global Water Trends
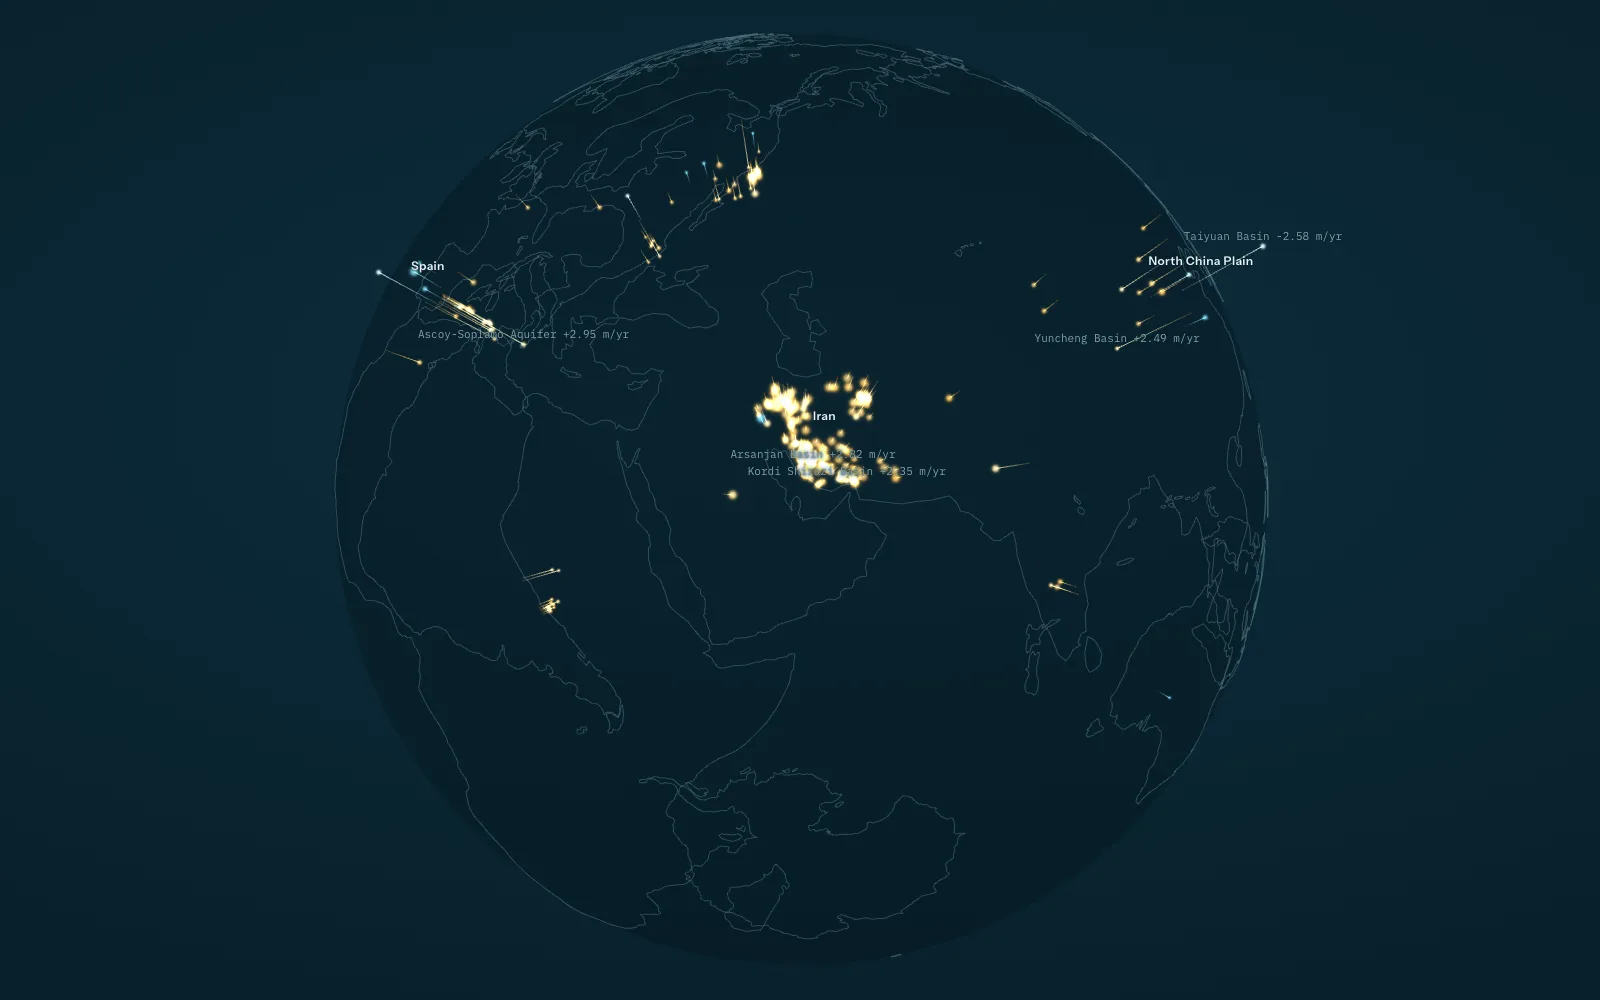
Groundwater, stream temperature and lake inflow, drawn in three dimensions. Start with 1,693 aquifer systems worldwide, then move to the Okanagan: 32 observation wells, 24 temperature stations and the weekly water balance of Okanagan Lake.
Every scene carries its method, QAQC checks, known gaps and sources. Graphics and derived data are open under CC BY 4.0.
Datasets
-
 Global · 3D scene
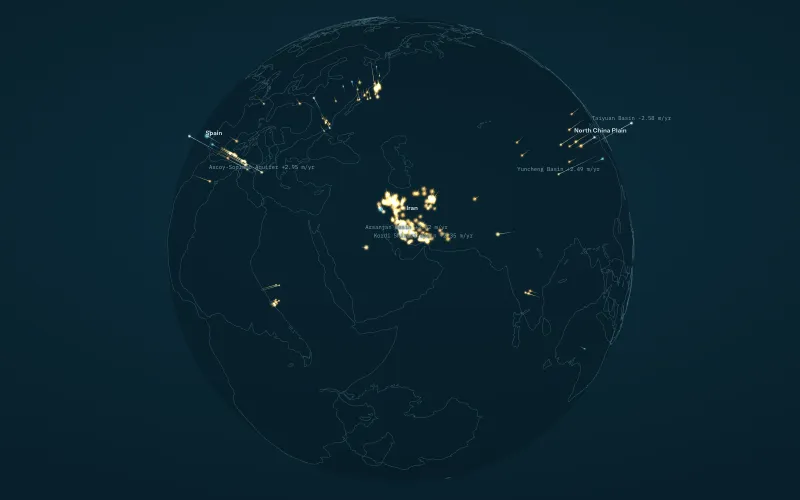
Global groundwater
Groundwater-level trends in 1,693 aquifer systems worldwide, 2000 to 2022, from Jasechko et al. (2024), drawn in 3D.
-
 Okanagan · 3D scene
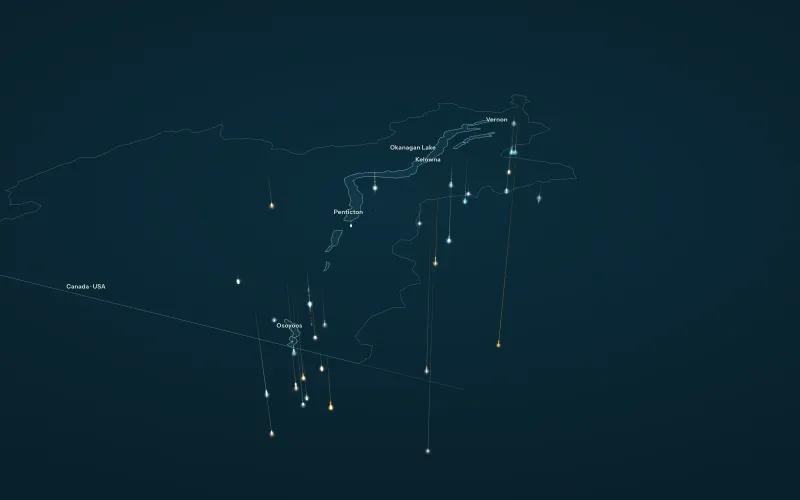
Okanagan groundwater
Depth to water in 32 Okanagan provincial observation wells, 2000 to 2026, with 2005 to 2025 Theil-Sen trends, drawn in 3D.
-
 Okanagan · 3D scene
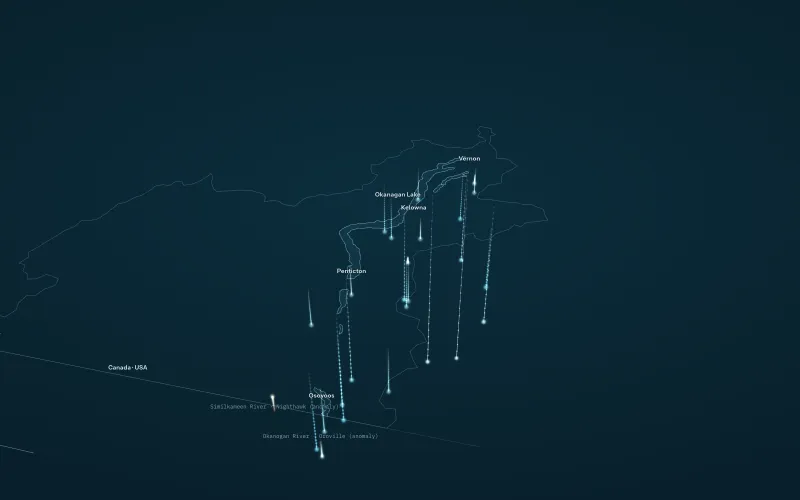
Okanagan stream temperature 2026
Weekly stream and lake temperature at 24 Okanagan stations, June to September 2026, compared with the same weeks of 2025.
-
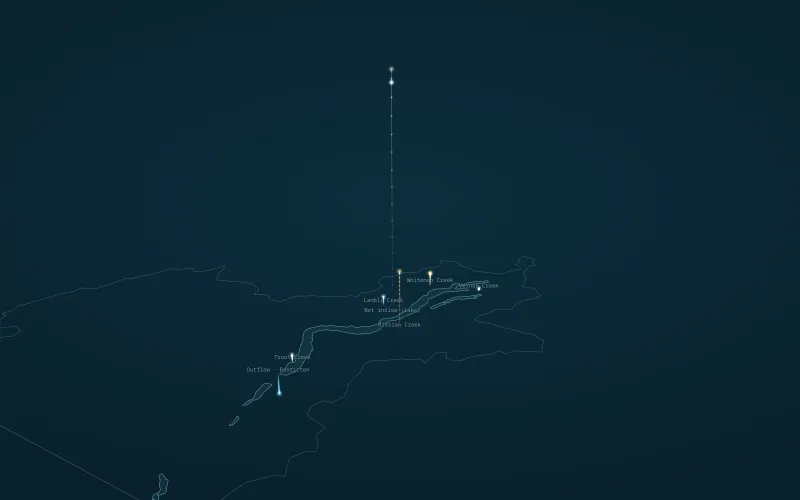 Okanagan · 3D scene
Okanagan Lake inflow, water year 2025
Weekly net inflow to Okanagan Lake, October 2024 to September 2025, against the 1991 to 2020 normal.
-
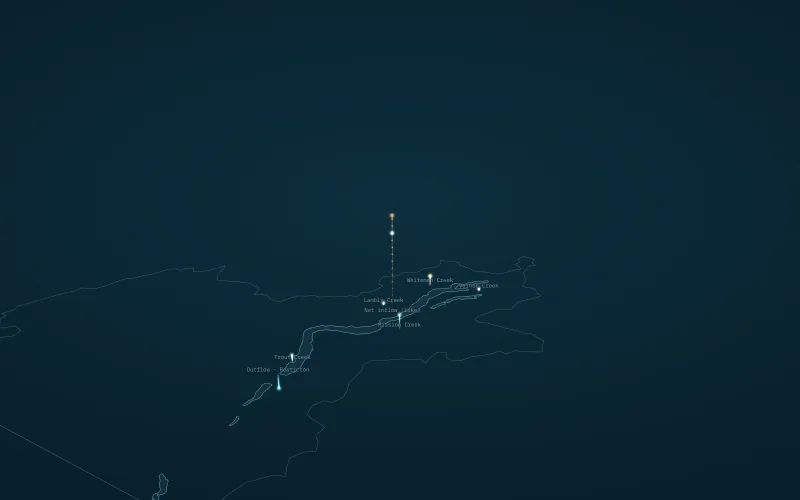 Okanagan · 3D scene
Okanagan Lake inflow, water year 2026
Weekly net inflow to Okanagan Lake, October 2025 to September 2026, against the 1991 to 2020 normal.
- Okanagan · Live tool temp.stream (opens another site) Monitors and forecasts stream temperature in Okanagan creeks, and flags when the thresholds that matter for fish and environmental flows are likely to be crossed, so managers can see a heat problem coming rather than read about it afterward.
- Okanagan · Live tool Okanagan Groundwater Risk Tool (opens another site) Brings groundwater into the drought picture. It tracks conditions across Okanagan aquifers and shows where levels are trending toward stress, alongside the surface water that most monitoring already covers.
- Okanagan · Live tool State of the Okanagan Reservoirs (opens another site) A real-time read on storage across the valley’s mainstem lakes and upland reservoirs: the water actually in the bank heading into a season.
No datasets match.